
Monitor everything. Verify what matters.Understand incidents faster.
StatusEagle monitors websites, APIs, servers, cron jobs, certificates, domains, and visitors from one dashboard. Alerts are verified before you’re notified.
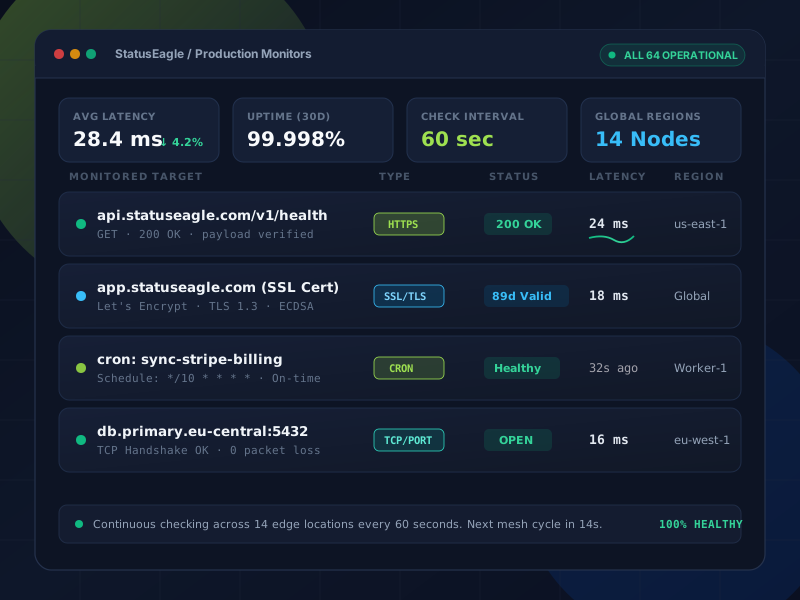
All monitors healthy. Watching 24 checks across 3 locations.
Demo data · location names shown generically
Monitoring for manufacturers, retailers, agencies and SaaS teams, including
AI that does the tedious part of every incident.
Not a chatbot bolted on the side. Six small, useful jobs built from your own monitor data. Every answer shows its evidence, and nothing reaches customers without a person’s approval.
Alerts in plain English
“HTTP 502 from all 3 locations: the app behind your proxy isn’t responding. Check the app process first.”
Reverse proxy is online, but backend listener on 127.0.0.1:3000 is dropping connections.
One-paragraph incident summaries
What failed, where, since when, and what changed just before, written as the incident unfolds.
Checkout & Auth API
us-east-1 • Node cluster 04
14:02 UTC (8m duration)
Deploy #392 (13:59 UTC)
At 14:02 UTC, Checkout API in us-east-1 returned elevated 500s following Deploy #392. Traffic rerouted while rollback executes.
Status update drafts
Investigating → Resolved, in your tone. You approve before anything is published.
Postmortem first drafts
Timeline, impact, detection and recovery times, and suggested follow-ups, ready to edit.
Weekly reliability digest
Noisiest monitors, slowest endpoints, and certificates and domains expiring soon, every Monday.
Monitor suggestions
Add your domain and get a suggested starter set: key pages, subdomains, SSL, domain and cron.
StatusEagle monitors your entire stack from one dashboard.
Websites, APIs, servers, cron jobs, certificates, domains, and visitors. Alerts are verified before you’re notified.
Not another uptime checker. One workflow from first signal to customer update.
Checking a URL every minute is the easy part, and every tool does it. What decides how an outage goes is what happens next: is it real, what broke, who knows, and what do customers see? StatusEagle is built around those five steps.
Continuous multi-check coverage
HTTP, API, ping, port, keyword, cron, SSL, domain, network and real user checks, on 60-second intervals.
- HTTP, API, ping, port, keyword & network checks
- Cron heartbeats, SSL certificates & domain DNS watch
- 60-second global checking intervals across edge regions
Your monitoring is loud.
What you need is signal.
Most teams don't lack alerts. They lack alerts they can trust, and the context to act on them. Every false page trains people to hesitate, and the one time they hesitate is usually the outage that matters.
3:12 AM: "DOWN" · recovered 40 s later
Same outage, 14 separate alerts
Customer emails before the dashboard turns red
SSL expired on a subdomain nobody tracked
Nightly backup failed silently for 9 days
One tool for uptime, another for status pages
Domain renewal email went to a former employee
"Is it us or the network?", 20 minutes of guessing
Debugging our code for 25 minutes. It was the payment provider.
StatusEagle brings it into one place, and checks before it shouts.
Uptime, SSL, domains, ports, cron jobs, network devices and real user data share one dashboard, one alert policy and one status page. Failures are confirmed before they become pages.

One platform. Every layer your customers touch, and the vendors behind it.
A single website monitor already covers uptime, response time, SSL expiry and domain expiry: things most tools make you set up as four separate checks. Add the rest as you need them.
StatusEagle monitors every layer: endpoints, APIs, crons, SSL, domains, network devices and real user data in one unified dashboard.
Checks before it shouts. Automated local retry, multi-region quorum consensus across global edge nodes, and AI root cause synthesis.
Configurable alert escalation, granular ownership routing to Slack, SMS, Discord & webhooks, and automated branded status pages.
Every layer from synthetic HTTP to real user browser vitals and edge hardware.
Website & endpoint monitoring
HTTP/HTTPS checks with status-code validation, response time, SSL and domain expiry.
API monitoring
REST endpoints with auth headers, expected codes and response-body checks.
Keyword monitoring
Alert when text appears or disappears. Case-sensitive or regex.
Ping monitoring
ICMP reachability and latency for servers and hosts.
Port & UDP monitoring
TCP and UDP checks for databases, mail, SSH, DNS and VPNs.
Cron job monitoring
Heartbeat URLs that alert when a scheduled job misses its run.
Third-party monitoring
SoonKnow when Stripe, AWS or Cloudflare has an incident, next to your own monitors.
Multi-location verification
Every failure retried and confirmed from another location before alerting.
Response time monitoring
Per-location response times, medians and slowest checks over time.
SSL monitoring
Expiry, issuer and validity, with alerts days before a certificate lapses.
Domain & DNS monitoring
WHOIS expiry reminders today; DNS record change alerts coming soon.
Real user monitoring
Visitors, Core Web Vitals (LCP, CLS, INP, FCP) and JS errors from real browsers.
Network monitoring
ICMP + SNMP v1/v2c/v3 for Cisco, Juniper, MikroTik and Fortinet devices.
Incident management
Automatic incidents with cause, locations, timeline and acknowledgement.
IT alerting
Email, SMS, Slack, Discord, phone call and webhooks, routed per person.
Status pages
Branded public pages with your domain, incidents, maintenance and subscribers.
TypeError: cart.items is undefined
/checkout · Safari 17 · 3 sessions
Your monitors say "up."
Your users may disagree.
Synthetic checks prove a page responds from a data centre. They can't tell you that a script error broke checkout on Safari, or that LCP doubled for mobile visitors. Real user monitoring fills that gap.
Tell customers
before they ask.
Your status page is connected to the same monitors that page your team, so it reflects reality without someone remembering to update it. When you need words, post an incident update in seconds.
- Custom domain, logo, brand colours, light/dark themes and custom CSS
- Service components with historical uptime bars
- Incident timelines and scheduled maintenance windows
- Email subscribers, RSS feed and webhook notifications
- Page-view and subscriber analytics
Acme status
All systems operational
Every incident, with the facts attached.
When a failure is confirmed, StatusEagle opens an incident with the detected cause, affected monitor, start time and duration. Acknowledge it to move it from open to investigating, and your team sees who has it.
Automatic incidents
Opened on confirmed failure with the error your monitor saw: “Connection refused”, “HTTP 502”, “keyword missing”.
Alerts that reach people
Email, SMS, Slack, Discord, phone-call and webhook alerts, routed per team member.
Maintenance windows
Schedule planned work so expected downtime neither pages your team nor counts as an outage.
*StatusEagle confirms every incident across multiple independent test nodes before dispatching pages. Learn about two-location verification
Alerts go where your team already is.
Choose channels per monitor and per team member, so the person who owns the checkout API hears about the checkout API, and nobody else is woken up.
Interactive Alert Routing Simulator
Select a service to see targeted on-call notification routing in real time.
Nobody woken up
+1 (555) 019-2834
#eng-checkout-alerts
Nobody woken up
+1 (555) 438-9210
Nobody woken up
Every plan
[CRITICAL] Checkout API failed in US-East: HTTP 502 Bad Gateway. 2 locations confirmed.
SMS
Text alerts to on-call phones
StatusEagle Alert: Checkout API down. Error: Connection reset. Tap to ack: statuseagle.com/ack/8912
Slack
Post to a channel
🚨 Incident #492 opened: Checkout API (us-east-1) responded with HTTP 502. Assigned: Sarah J.
Discord
Via Discord webhook
StatusEagle Bot: [DOWN] Cart Service · 2.4s timeout · Click here to view live trace.
Phone call
Your Twilio or Telnyx account
Voice Call: 'StatusEagle alert for Checkout API. Confirmed failure from Frankfurt and Virginia.'
Webhooks
Send JSON to any endpoint
{"event":"incident.opened","monitor":"checkout-api","code":502,"acknowledged":false}
Direct Provider Rates (BYOC)
Phone-call alerts use your own Twilio or Telnyx credentials, so you pay your provider's rates directly with zero middleman markup.
Production-Ready Guarantee
Live TodayOnly channels that ship today are listed. No placeholder roadmaps, waitlists, or coming soon promises — configure live on day one.
Built for the teams who get the 3 AM call.
Whether you run customer-facing APIs, checkout funnels, multi-client agency fleets or bare-metal routers — StatusEagle gives your team verified visibility.
SaaS
Customers notice API errors and slow dashboards before your team does, then flood support.
Monitor every public endpoint with auth headers, verify failures across locations, and post updates to a status page linked to those monitors.
Ecommerce
A broken “Add to cart” button can return HTTP 200 while revenue drops to zero.
Keyword monitors confirm checkout content is present, RUM shows JS errors by browser, and SSL/domain checks prevent avoidable outages at peak.
assert "Add to cart" in DOMAgencies
Dozens of client sites, each with its own certificate, domain and hosting quirks.
One dashboard for every client, a branded status page per client, and domain/SSL reminders so renewals never slip.
Developers
Side projects and production apps both need monitoring you can set up in minutes and query from code.
Create monitors in the dashboard, read status and incidents from the REST API, and heartbeat your cron jobs with one curl.
GET /v1/monitors?status=upDevOps & SRE
Alert fatigue erodes on-call trust; flaky pages hide real incidents.
Multi-location verification cuts transient pages; ports, ping and SNMP cover the layers below HTTP.
IT teams
Routers, firewalls and internal services fail without anyone outside noticing.
ICMP and SNMP monitoring for Cisco, Juniper, MikroTik and Fortinet devices alongside the services they carry.
We run the tool you rely on during outages. We take that seriously.
When your services go down, StatusEagle must stay up. We build transparency, security, and privacy directly into our core architecture.
Security
HTTPS everywhere, API keys you can rotate, and role-based team access.
Transparency
We publish our own uptime and incidents on a public status page, using StatusEagle.
Privacy
RUM collects performance and error data, not personal content. Data-handling details are in our privacy policy.
Aggregated rendering speed and frontend responsiveness metrics.
Frontend JavaScript exceptions and endpoint error codes.
Zero user emails, usernames, addresses, or phone numbers.
Stripped at the edge before telemetry touches our servers.
Enterprise Compliance Policy
Compliance: list certifications (e.g. SOC 2, ISO 27001, GDPR DPA) only once they exist. Certifications are listed strictly upon formal audit completion with zero premature claims.
Standard Contractual Clauses (SCCs) and Data Processing Addendum ready for EU/UK customers.
Formal audit controls mapped to Trust Services Criteria. Listed officially upon issuance.
Information security management practices mapped to ISO standards.
An incident analyst that shows its evidence.
When something breaks, the first 15 minutes go to the same questions: what changed, where, and is it related to anything else? Eagle Intelligence answers them from your own monitor data, and says so when it can’t.
Ask a question about any incident and get an answer built from the checks, locations and timings behind it. Try the examples on the right.
Which domains expire in the next 30 days?
2 domains expire within 30 days:
- 1.acme-shop.example — 12 days (registrar auto-renew: off)
- 2.acme-status.example — 27 days
Stop chasing false alarms.
A single failed request is not an outage. Packet loss, a DNS hiccup or a busy upstream can fail one check and pass the next. StatusEagle treats a failure as a question, not an answer.
A check fails
One location reports a timeout, a 5xx, a missing keyword or a closed port. No alert is sent.
Retry immediately
The same location checks again to filter out momentary blips. You choose how many retries.
Dropped quietly
If a retry succeeds, the event is logged for history and nobody is woken up.
Check other locations
Still failing? Independent locations run the same check to confirm it isn’t local.
Confirmed: you’re paged
An incident opens with cause, affected locations and start time, and your status page can update.
If StatusEagle pages you, stop what you’re doing. It has already checked twice.
Trade-off, stated plainly: verification adds a short delay (the retry and cross-location checks) before an alert. For most teams, fewer false pages is worth seconds. You can lower retries per monitor if you need the fastest possible signal.
Flat, published prices. No per-seat surprises.
Every plan includes all monitor types and 3 monitoring locations. Plans differ by how many monitors, how often they check, and how many people and status pages you need.
Free
Essential checks for side projects & personal sites.
Base
Fast checks for startups and growing web apps.
Professional
High resolution monitoring with on-call team escalation.
Enterprise
High CapacityHigh capacity for mission-critical infrastructure & fleets.
Your first monitor takes about two minutes.
Free plan: 10 monitors, 3 locations, 1 status page. No credit card.
Questions teams ask before switching
Still deciding? Start monitoring free and verify your first service in ~2 minutes.
StatusEagle is a monitoring platform for websites, APIs, servers, network devices and scheduled jobs. It checks your services from multiple locations, confirms a failure before alerting your team, and publishes the result to a branded status page for your customers. More in about StatusEagle.